On the morning early of 04/06/17, TAFB forecasters noted a nice V-pattern to convection at the tail end of a front in the northeast Gulf of Mexico. The increased temporal and spatial resolution of GOES-16 compared to the GOES-13 (east) provided more details on the organization and maintenance of the convective line that would otherwise have been analyzed.
GOES-16 0.64 um “Red” visible animation showing strong convection in the eastern Gulf of Mexico, valid 0900 UTC – 1600 UTC on 04/06/17. *Preliminary, Non-Operational Data* Click to Enlarge
Hugh Cobb (TAFB Branch Chief) noted: “We also looked at the Red VIS Band 2 for this event. The VIS imagery was more striking in that you could see the shadows of the high cirrus cast on the lower cloud deck in the animation and the “beavertail” of of the low clouds feeding into and maintaining the deep convection.”
GOES-16 10.3 um “Clean” infrared animation (same as above), valid from 0900 UTC – 1600 UTC on 04/06/17. *Preliminary, Non-Operational Data* Click to Enlarge
GOES-16 10.3 “Clean” infrared imagery with 5-minute GLD-360 lightning density overlaid, valid 0900 UTC – 1600 UTC on 04/06/17. *Preliminary, Non-Operational Data* Click to Enlarge
Jorge Aguirre-Echevarria (TAFB Forecaster) noted that “the striking cloud/convective signature and associate lightning activity observed that day over the waters of the far southern Gulf of Mexico.” In particular, these events are rather rare at such a low latitude in the TAFB Offshore Zones. The GOES-16 10.3 μm infrared imagery proved to be very helpful in seeing the overshooting tops and the cold cloud canopy temperatures which signified the activity would persist west of Key West, FL.
Strong thunderstorms erupted on the evening of 04/28/17 and continued into the overnight, expanding in coverage and producing prolific lightning in spots. The Weather Prediction Center’s Metwatch Desk was particularly busy issuing multiple Mesoscale Precipitation Discussions (MPD) to stay ahead of the flash flood threat.
WPC MPD #0150 issued by forecaster, Greg Gallina, at 0015 UTC on 04/28/17. Click to enlarge
NWS Forecaster, Greg Gallina, indicated the following:
“GOES-16/EAST WV LOOP SHOWS A RELATIVELY FLAT SHORTWAVE ACROSS NW OH WITH THE TRAILING TROF SW ACROSS CENTRAL IND/IL WITH A MCS TRACKING ACROSS CENTRAL IND. THIS MCS IS AT THE APEX OF SOUTHWESTERLY LOW LEVEL JET/WAA REGIME OVERRUNNING A WARM FRONT THAT EXTENDS FROM LWV…N OF LOU AND S OF CVG. THIS COMPLEX HAS BEEN PRODUCING 1.5-2.5″ RAIN AS IT TRACKED THROUGH WEST CENTRAL IND…AND WILL LIKELY MAINTAIN AS IT CROSSES INTO LOWER FFG VALUES ACROSS SE IND/SW OH IN THE NEXT HOUR OR SO.”
GOES-16 6.9 um “mid-level” water vapor animation valid from 1800 UTC – 2357 UTC on 04/28/17. *Preliminary, Non-Operation Data*Click to enlarge
As Greg mentioned, GOES-16 6.9 μm “mid-level” water vapor imagery shows a relatively flat shortwave aiding in the maintenance of the Mesoscale Convective System (MCS) over Indiana and Ohio, while a stronger shortwave can be seen moving out of Iowa into southeastern Minnesota. What other features can you identify in this animation?
GOES-16 1-minute 0.64 um “Red” visible animation valid from 2130 UTC 04/28/17 to 0059 UTC 04/29/17. *Preliminary, Non-Operational Data*Click to enlarge
The GOES-16 1-minute 0.64 μm “Red” visible animation shows the incredible detail in the cloud top environment (0.5 km resolution) of the aforementioned MCS moving through Indiana and Ohio. Note the persistent overshooting tops and their subsequent gravity waves rippling across the cirrus shield. This is indicative of healthy, organized updrafts which a forecaster can then make a decision on whether the activity will persist, strength, or weaken with time.
GOES-16 1-minute 10.3 um “Clean” infrared animation valid from 2130 UTC 04/28/17 to 0259 UTC 04/29/17. *Preliminary, Non-Operational Data*Click to enlarge
Once again, the 1-minute imagery proves valuable here as the trend of the cold cloud tops can be seen expanding with the MCS, while new convection fires near the Illinois, Kentucky, and Indiana borders. Note the dark pixels indicating very cold overshooting tops. Can you spot the enhanced-V structures down-stream from those towers?
WPC MPD #0151 issued by forecaster, Andrew Orrison, at 0300 UTC on 04/29/17. Click to enlarge
As noted by NWS forecaster, Andrew Orrison:
“EXPERIMENTAL GOES-16 IR IMAGERY CONFIRMS THAT CONVECTIVE INITIATION IS UNDERWAY IN AN ELEVATED FASHION ACROSS AREAS OF SOUTHERN MO…FAR NORTHWEST AR AND PARTS OF EASTERN OK. A STRENGTHENING AND VERY MOIST LOW LEVEL JET COUPLED WITH GRADUALLY IMPROVING RIGHT-ENTRANCE REGION JET DYNAMICS IN VICINITY OF A WELL-DEFINED QUASI-STATIONARY FRONTAL ZONE SHOULD FACILITATE A SW/NE AXIS OF STRONG THUNDERSTORMS WITH INTENSE RAINFALL RATES OVER THE NEXT FEW HOURS.”
GOES-16 CONUS (5-minute) 10.3 um “Clean” infrared imagery with the 5-minute GLD-360 lightning density product overlaid, valid from 2130 UTC 04/28/17 to 0256 UTC 04/29/17. *Preliminary, Non-Operational Data*Click to enlarge
The ongoing MCS in the above GOES-16 10.3 μm “Clean” infrared animation with GLD-360 5-minute lightning density overlaid appears to weaken a bit as new convection farther southwest takes advantage of a stout low-level jet. Notice how the lightning cores are exceeding the color scale that was set by the developers at OPC and NESDIS. Grant it, the color scales are somewhat limited by the GEMPAK software (6.5 bit or 96 colors), yet it’s safe to assume the lightning activity is very intense.
WPC MPD #0154 issued by forecaster, Andrew Orrison, at 0500 UTC on 04/29/17. Click to enlarge
Finally, around 0500 UTC on 04/29/17, Andrew Orrison again referenced GOES-16 in his analysis of the well-defined (new) MCS which developed overnight:
“THE SATELLITE PRESENTATION OF THE CONVECTION IS VERY IMPRESSIVE WITH THE EXPERIMENTAL GOES-16 10.3 MICRON/IR IMAGERY DEPICTING A VERY LARGE AREA OF VERY COLD CONVECTIVE CLOUD TOPS…REACHING NEARLY -80C…WITH NUMEROUS OVERSHOOTING TOPS EMBEDDED WITHIN THE CONVECTIVE MASS. THIS IS INDICATIVE OF VERY STRONG FORCING WHICH IS ENHANCED NOT ONLY IN THE LOW LEVELS GIVEN THE LOW LEVEL JET AND ISENTROPIC ASCENT…BUT ALSO BROADLY DIFFLUENT FLOW ALOFT ASSOCIATED WITH RIGHT-ENTRANCE REGION JET DYNAMICS.”
GOES-16 CONUS (5-minute) 10.3 um “Clean” infrared animation valid from 2202 UTC 04/28/17 to 0857 UTC 04/29/17. *Preliminary, Non-Operational Data*Click to enlarge
As Andrew referenced in his MPD, as the night progressed, the convection along the Midwest through Ohio Valley erupted into an elongated MCS with embedded Mesoscale Convective Vortices (MCVs) that will have to be watched later in the day.
WPC Day 1-3 QPF issued at 2040 UTC on 04/28/17 and valid from 0000 UTC 04/29/17 to 0000 UTC 05/02/17. Click to enlarge
As you can see in the above Quantitative Precipitation Forecasts for Day 1 (top) and Days 1-3 (bottom), this was only the beginning of a prolonged flood threat for the Mid-Mississippi Valley and eventually farther north to western Michigan.
GOES-16 is certainly proving to be useful in operations as the increased temporal and spatial resolutions when compared to GOES-E (13) and GOES-W (15), provides more detail, fluidity, and trend monitoring to assist in the forecast decision-making process. Additional channels, multispectral imagery (RGBs), band-differences, and derived products will be explored throughout 2017, so please stay tuned for more posts!
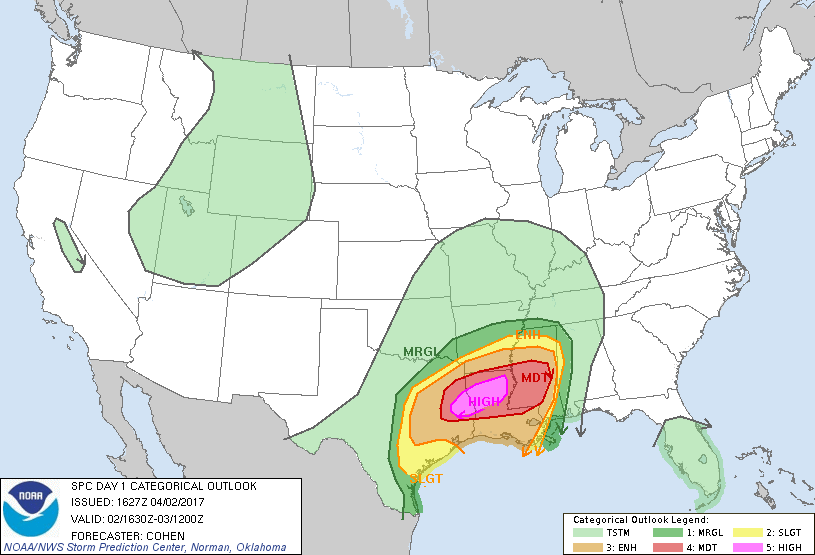
A significant severe weather event impacted E TX, LA, and MS on Sunday, April 2. A SPC Moderate Risk for severe had a region upgraded to High at the 1630 UTC Day 1 outlook for the tornado threat. Given the threat, GOES-East RSO was requested by SRH, and Mesoscale Domain Sector 1 granted over the region. The early day setup included a closed upper low moving NE across central Texas towards Arkansas. At the surface, an MCS and associated cold pool from the previous evening was traversing eastward through Texas. Ahead of this feature, strong southerly flow drew up warm, moist Gulf air.
The evolution of the overnight MCS is depicted in 5-min GOES-16 ABI 10.4 um clean window IR imagery below. This channel is the “cleanest” of the IR channels because it is least sensitive to absorption by atmospheric constituents such as water vapor. The development of thunderstorms during the evening of the 1st is seen as rapid cooling of the cloud tops in SW Texas. The rapid expansion of the cold cloud tops signals the continued maintenance of convection, and development of an MCS. By early morning on the 2nd, rapid warming becomes evident, especially on the southern end of the MCS, signaling a weakening and dissipation of thunderstorm activity. The higher spatial (2km vs 4 km) and temporal (5-min vs 15-min over CONUS) resolution of the GOES-16 satellite allows for these cloud top temperature trends to be more easily and promptly diagnosed.
By late morning, convection began to develop within the warm sector in E Texas and Louisiana ahead of the previous evening’s weakening cluster of thunderstorms. These storms quickly became severe, producing large hail, wind and tornadoes. Detection of convective initiation is significantly improved in the 1-min, 0.5 km visible imagery, as was shown in a previous blog post that compared GOES-16 data with GOES-13 data for initial storm development.
Storm top features of mature convection are also easier to discern in the GOES-16 imagery compared to current GOES satellites. Below is a side-by-side comparison of 0.5 km, 1-min VIS from GOES-16 and 1 km, Rapid Scan (5-15 min) VIS from GOES-13. Additionally, GOES-16 2 km, 1-min IR is compared with GOES-13 4 km, Rapid Scan IR. The time period is 2145 UTC to 2315 UTC. Storm top features apparent that are associated with strong-severe weather at the surface include overshooting tops, enhanced-V’s, and above-anvil cirrus plumes. Gravity waves emanating from the updrafts, indicators of turbulence and caused by strong updrafts, are also more obvious in the GOES-16 data.
The Geostationary Lightning Mapper (GLM) is the other new earth-pointing instrument aboard the GOES-R series of satellites, and can detect total lightning activity with uniform detection efficiency. Data from the GLM are not yet available, however ground-based networks can be used to get a feel for how GLM data will generally look in AWIPS. Plotted is GOES-16 2-min visible imagery with Earth Networks 1-min Total Lightning Pulse density data, binned in 8-km grid boxes to match the resolution of the GLM, overlaid as semi-transparent. Pulses are a very basic variable, and when binned into grid boxes over a time period, provide a good measure of fluctuations in lightning activity. Max’s in total lightning density activity signify the core updraft regions of thunderstorms, which are also represented in visible imagery by a high degree of texture and overshooting tops. Rapid increases in lightning density signify rapid upticks in updraft strength, and thunderstorm intensification. Similarly, decreasing trends in total lightning activity will signify a weakening storm.
By early evening, the strong/severe storms had organized into a linear system, and while the severe threat had lessened, a flash flood threat had begun. A separate post will be written with details about the flood event.
– Bill Line, NWS
“The GOES-16 data posted on this page are preliminary, non-operational data and are undergoing testing. Users bear all responsibility for inspecting the data prior to use and for the manner in which the data are utilized.”
On the afternoon of 03/31/17, severe thunderstorms, including a couple long-lived supercells, moved across the southeastern most part of Virginia leaving behind a path of hail, wind damage, and at least one tornado, with two more reported in northeast North Carolina. These storms developed in association with a mid-level trough and related surface cyclone and cold front.
GOES-16 10.3 um “Clean” infrared animation valid on 03/31/17. Made using GEMPAK. *Preliminary, Non-Operaitonal Data*Click here to open in a new window.
The 10.3 µm “Clean” infrared channel on GOES-16 shows the large storm system transitioning to the East Coast with a dry slot that moves into eastern NC/VA quickly erupting into thunderstorms. Note how the cloud tops associated with the secondary band that develops in the afternoon quickly cool, then appear to jump to the Gulf Stream. This becomes a forecast challenge for the local National Weather Service offices as the storms transition from the land, to nearshore water, then to OPC’s offshore zones.
GOES-16 6.9 um mid-level water vapor animation valid on 03/31/17. Made using GEMPAK. *Preliminary, Non-Operational Data*Click here to open in a new window.
GOES-16 7.3 um low-level water vapor animation valid on 03/31/17. Made using GEMPAK. *Preliminary, Non-Operational Data*Click here to open in a new window.
The 6.9 µm and 7.3 µm water vapor channels show the enhanced warming (drying) in the mid to low levels where the atmosphere becomes unstable in the presence of near-surface warming/moistening and strong forcing with the upper-low coming in from the west. The supercell ahead of the main forcing remains isolated until later in its lifecycle with the dry slot aiding in the instability.
Zooming in on the area of thunderstorm development in the 7.3 µm low-level water vapor channel (~700 mb), the region of enhanced mid/low-level drying/warming ahead of the cold front within which isolated thunderstorms developed is apparent. Behind the cold front, that region of the atmosphere is expectedly cooler. The 7.3 µm channel is new with the GOES-R series, and when combined with the higher spatial and temporal resolution, allows forecasters to track (for the first time) low/mid-level features such as elevated mixed layers and cold fronts aloft.
00Z Weighting functions (UW/CIMSS) from the GOES Sounder 7.4 µm channel (very similar to ABI 7.3 µm) at MHX (just south of strongest t-storms) confirms that the drying/warming we are seeing is centered around 700 mb.
Radiosonde profiles at Morehead City, NC (left, ahead of cold front) and Roanoke, VA (right, behind cold front). Click here to open in a new window.
Looking at 00z soundings for comparison, mid-level drying was indeed present above near surface warming/moistening ahead of the cold front in Morhead City, NC leading to an unstable atmosphere. Meanwhile behind the cold front at Roanoke, VA, the cooler surface and moistening aloft led to a significantly less unstable environment.
GOES-16 10.3 um “Clean” infrared with the GLD-360 15 minute Lightning Density product overlaid, valid 0000 UTC 03/31/17 – 0645 UTC 04/01/17. Made using GEMPAK. *Preliminary, Non-Operational Data*Click here to open in a new window.
The 10.3 µm “Clean window” infrared channel overlaid with the 15-minute GLD-360 lightning density product produced at OPC, shows the rapid increase in lightning activity as the storms in the dry slot mature. This lightning density has proven quite useful to forecasters as a proxy to the Geostationary Lightning Mapper (GLM) that is located on GOES-16. The OPC forecasters can then use this information to characterize the thunderstorms as they move offshore into active shipping and fishing areas.
These storms developed within mesoscale domain sector (MDS) 1. This meant that 1-min imagery was available for this event even though no domain was requested, and because a domain was not requested elsewhere. The 1-minute, 0.5 km 0.64 µm “Red” visible imagery shows isolated supercell thunderstorms developing out ahead of the cold front in a warm, moist atmosphere. Additional development is noted along the cold front, which raced towards and caught up to the isolated thunderstorms by sun down.
GOES-16 0.64 um “Red” visible, 1-minute imagery with the GLD-360 2-minute Lightning Density overlaid, valid from 2000 UTC to 2358 UTC on 03/31/17. Made using GEMPAK. *Preliminary, Non-Operational Data*Click here to open in a new window.
The 1-minute 0.64 µm “Red” visible imagery with the 2-minute GLD-360 lightning density overlaid shows the uptick in lightning associated with the isolated supercell that moves through Chesapeake, VA and exits around Virginia Beach. Note the increased lightning intensity around the time of the tornado.
Forecasters are looking forward to using the GLM data with the imagery to help better forecast thunderstorm over land and especially over the oceans.
The preliminary storm surveys from the Wakefield, VA NWS Weather Forecast Office are included below for your convenience.
Thanks for reading!
Michael Folmer (CICS) and Bill Line (NWS)
“The GOES-16 data posted on this page are preliminary, non-operational data and are undergoing testing. Users bear all responsibility for inspecting the data prior to use and for the manner in which the data are utilized.”
Hurricane Matthew. . .a storm that will be remembered for the challenges, strange structures, maneuvering path, weird (sinister) face images in satellite imagery, and unusually low (observed) pressures regardless of satellite appearance.
The 10/06/16 5 pm EDT NHC forecast track for Hurricane Matthew.
GOES-13 (east) 10.7 um infrared animation showing Hurricane Matthew’s trek through the middle Bahamas on 10/06/16.
As you can see in the GOES-13 infrared animation above, the structure of Matthew has gone through a few changes today with some northerly shear blunting the northern portion of the hurricane, although this hasn’t lead to any notable weakening as of yet. In the last couple of frames, very strong convection fires again as the hurricane is approaching Grand Bahama. Also of note is the strong area of convection that fired to the northeast of Matthew today, though not as strong as what was seen in the Caribbean over the weekend.
GOES-13 10.7 um infrared imagery with Vaisala GLD-360 lightning density overlaid at 15 minute intervals.
The GOES-13 infrared imagery with GLD-360 15-minute lightning density overlaid shows a couple distinct areas of lightning activity, the aforementioned convection to the northeast and another area in the northeast eyewall. This latter area has been pulsing all day and may suggest that the shear mentioned earlier was being fought off by the deep pulses of convection. Note that this area passed over the western portion of Providence Island and is getting ready to move ashore in southwest Grand Bahama. This is where the aircraft is showing the strongest winds (near 120 kts or 140 mph).
NOAA Unique Combined Atmospheric Profiles (NUCAPS) pass overlaid on GOES-13 10.7 um infrared imagery in AWIPS II. The black circle represents the sounding location provided below.
NUCAPS sounding (black circle on above image) showing some drying and warming above 700 mb to the north of Hurricane Matthew. Note that this isn’t a clean sounding since there are clouds in the scene, but the multiple warm layers are certainly interesting.
So, where did this shear originate from? I haven’t quite found the source, but I did pull up a NOAA Unique Combined Atmospheric Profiles (NUCAPS) sounding that may not be the most representative of the northern portion of the cyclone due to clouds, but does show an interesting drying at mid-levels. Note there are no winds as this is a satellite-borne sounding looking down, not to be confused with a raob.
GOES-13 10.7 um infrared imagery with the GOES-R Rain Rate/QPE product overlaid showing nearly instantaneous, 15 minute rain rates during Hurricane Matthew’s path over western Haiti and eastern Cuba.
Another product that has been available to forecasters at the National Hurricane Center, Weather Prediction Center, and NESDIS Satellite Analysis Branch is the GOES-R Rain Rate/QPE product provided by Bob Kuligowski at NESDIS. These are 15 minute rain rates that are derived using infrared brightness temperatures, then calibrated with microwave imagery. Note the values near the eyewall approaching 1″-1.50″ per 15 minutes!!!
GOES-R Rain Rate/QPE product showing the 7-day accumulated precipitation along Hurricane Matthew’s path.
The 7-day QPE accumulation image above shows many values over western Haiti and eastern Cuba approaching and exceeding 20″, which might even be conservative in the higher terrain areas. Note other interesting features like the rain shadow in northern Dominican Republic and amounts that exceed (then re-accumulate) 20″-45″ near where Matthew slowed north of Columbia. The now infamous “convective blob” is where the largest totals are located and might be reasonable for this case considering the extreme lightning and intensely cold cloud tops.
GOES-13 10.7 um infrared imagery with Vaisala GLD-360 lightning density overlaid during Hurricane Matthew’s rapid intensification cycle from 09/30/16 – 10/02/16.
This final animation shows the very intense lightning activity associated with the inner core organization and infamous “convective blob” that was trailing Hurricane Matthew through the southern Caribbean. The persistent lightning in the northern eyewall is interesting in that it’s rather atypical for rapid intensification in Atlantic hurricanes. Meanwhile, the lightning associated with the blob is very intense at 15 minute increments and helps support those extreme rain amounts that fell over the Caribbean.
Thank you for reading and feel free to comment/ask questions!
The last 24 hours has been quite interesting for residents along the Gulf Coast as a long-lived Mesoscale Convective Complex (MCC) traversed the region, seemingly reinventing itself through propagation and regeneration of the mesoscale convective vortex (MCV) at various points. The storms dropped very impressive 1-3″ rainfall amounts in an hour or less and produced winds in excess of 70 mph in parts of Louisiana, including a gust to 68 mph in Baton Rouge. Aided by a shortwave disturbance that ejected out of Northern Mexico/New Mexico early yesterday, this system continues moving east towards the GA/SC coast as new convection has flared up behind it off of LA, MS, and AL with a new MCV south of Mobile, AL that is helping to maintain the new system.
I put together an infrared animation of the MCC evolution starting at the TX coastline and ending this morning. I also put together an infrared and lightning density animation to emphasize the incredible amount of lightning that has been produced by these two complexes.
GOES-13 Infrared animation showing the MCC evolution overnight along the Gulf Coast starting 1815 UTC on 05/19/16 and ending at 1430 UTC on 05/20/16.
GOES-13 Infrared and GLD-360 15-min accumulated lightning density for the Gulf Coast MCC valid the same times as the previous animation.
Meanwhile, in the Indian Ocean (Bay of Bengal region), Tropical Storm Roanu has been wreaking much havoc from Sri Lanka to eastern India with copious amounts of rainfall and gusty winds. The tropical storm is experiencing shear today and racing towards Bangladesh, which hopefully will limit significant flooding concerns for that country. Winds are estimated to have topped out around 50 kts (58 mph), but the bursts of deep thunderstorms have been quite impressive.
I thought we could take two different perspectives on Roanu, one from Meteosat-7 and the other from the new Himawari-8. When looking at the animations below, notice the difference in detail between Himawari-8 and Meteosat-7 (2 km vs. 5 km and 10 min vs. 30 min, respectively). Also, notice there is a difference in projection (especially to the west of India). Do you know why this is happening?
Meteosat-7 11p5 µm infrared animation showing Tropical Storm Roanu affecting Sri Lanka and eastern India from 5/16/16 – 5/20/16.
Himawari-8 11.2 µm infrared animation similar to the Meteosat-7 imagery above, but at 2 km spatial resolution (closer to 4 km at this angle) and 10 minute increments.
The answer to the above question is parallax. The imagery looks skewed due to the viewing angle in relation to where the satellite center point is located (~141ºE, 0º) compared with Meteosat-7 (~58ºE, 0º) and the projection (a form of rectilinear), but the details are still quite impressive for Roanu.
So, it’s no secret. . .Hurricane Patricia is mean and is disrespecting the records and will soon visit Mexico in a most unwelcome way. With a current intensity of 175 kts (200 mph) and a central pressure that is a mindboggling 879 mb, this hurricane has joined the elite list of “most powerful storms ever recorded on Earth!” I would like to give you some satellite perspective of this incredible storm and I will let the animations do most of the talking.
GOES-13 Visible imagery animation valid on 10/23/15.
GOES-13 Infrared with the GLD-360 Lightning Density overlaid valid from 10/22/15 – 10/23/15.
The GOES-13 Infrared animation above with the GLD-360 Lightning Density product (produced at OPC) shows the intense bursts of lightning around the eyewall during the rapid intensification stage overnight and continuing into this afternoon. Typically this indicates weakening, but due to the relative lack of lightning in the outer bands (away form the northern band near the Mexico coast), I would hypothesize it’s more due to the intense thunderstorms activity in the eyewall with cloud-top temperatures near -90C.
GOES-15 Infrared animation showing Hurricanes Olaf and Patricia valid on 10/23/15.
Not to be outdone here, Olaf is also flexing its muscles with an intensity near 100 kts, but pales in comparison to Patricia.
Meteosat-10 Air Mass RGB animation of South Atlantic 934 mb low valid on 10/23/15.
Not to be completely outdone, a massive extratropical storm is strengthening in the South Atlantic Ocean north of Antarctica which the GFS initialized at 934 mb!
This is truly an incredible day and I didn’t even touch on the recurvature of Typhoon Champi, the heavy rains occurring and expanding from Texas into Louisiana, as well as the 3 hurricane-force storms that the Ocean Prediction Center is anticipating over the next couple of days in the North Pacific and North Atlantic!!!! These are busy days and I’ll try to post more to keep everyone updated with more satellite fun!
The Gulf of Mexico and Gulf Coast states have seen a plethora of thunderstorms since about mid-April. One of these episodes was a multi-day event that spanned April 16 – April 20. Multiple rounds of thunderstorms with very heavy rainfall (especially in and around Houston) and some significant severe weather (more hail and wind than tornadoes) traversed the region. The below animation shows these events and I included an example Mesoscale Precipitation Discussion (MPD) from WPC as a reference to the heavy rain.
GOES-13 Infrared imagery with GOES-R Lightning Detection (Density) spanning five days (04/16-4/20).
The Weather Prediction Center (WPC) Mesoscale Precipitation Discussion (MPD) for southeast Texas on 04/18/15.
More recently, on the evening of 04/22/15, a couple strong supercell thunderstorms moved off the Texas coast near the Corpus Christi area and traversed the offshore waters passing relatively close to a couple oil platforms. One of the more amazing attributes to the storms was the strong reflectivities of near 75 dbz! Although these were measured at high altitudes (based on the beam height), it’s interesting to note that large hail may have been occurring well offshore in the Tropical Analysis and Forecast Branch (TAFB) offshore zones. I have included a few animations showing the evolution of these supercells.
Animation of the GOES-R Convective Initiation product with GLD-360 lightning strokes overlaid valid 4/22-4/23.
National WSR-88D Mosaic base reflectivity with the Overshooting Top Magnitude (OTM) product overlaid highlighting the most intense updrafts associated with the supercells. The OTM product provides the difference between the overshoot and the surrounding cirrus clouds.
National WSR-88D Mosaic base reflectivity overlaid with the GOES-R Lightning Detection (Density) product in 5-minute increments. Note the extreme amount of lightning occurring with the dominant supercells in the Gulf of Mexico.
Here is a post from the National Weather Service Office in Houston-Galveston which nicely summarizes the threat posed to mariners from offshore supercells.
All mariners out there…this is why you should ALWAYS heed a Special Marine Warning. Buoy 42019 measured a 76 kt / 87 mph wind gust at 729 PM associated with this Gulf of Mexico thunderstorm!
While most of us thaw out after a rough February into the first week of March, winter weather-wise, the Southern Hemisphere is boiling with deep convection that has spawned three tropical cyclones near Australia and the South Pacific, one tropical cyclone in the West Pacific (a twin of sorts to TC Pam in the South Pacific), and an invest area near the coast of southern Brazil. There is a weak El Nino that is centered near the dateline in the West Pacific and there is currently a strong westerly wind burst associated with the current state (Phase 6 moving to 7) of the Madden-Julian Oscillation (MJO). TC Pam and TS Bavi look to have formed near this burst as part of the overall monsoon trough that straddled the equator. TC Nathan may have also formed due to the strength of the monsoon trough, while TC Olwyn formed well to the west on the other side of Australia.
I have put together some animations and a snapshot of the of the four storms near Australia and Guam.
MTSAT-2 Infrared satellite image of four concurrent tropical cyclones in the western Pacific and eastern Indian Oceans valid at 2032 UTC on 03/11/2015.
A four day animation that shows the development of TC Pam, TC Nathan, TC Olwyn, and TS Bavi valid from 03/08/15 to 03/11/15.
MTSAT-2 Infrared Satellite imagery with GLD-360 lightning strikes overlaid showing the lightning distribution (cloud-to-ground and some intra-cloud) associated with all four tropical cyclones valid from 1432 UTC on 03/10/2015 to 2032 UTC on 03/11/2015.
Finally, a new invest area has been identified near the southern coast of Brazil on the tail end of a mid-latitude storm system. This is rare, but not unprecedented as this area occasionally sees subtropical development during the Southern Hemisphere summer. The RGB Air Mass animation below shows the system still developing, but appears to be embedded in a cold core system as indicated by the orange, red, and purplish coloring. There is a significant amount of upper-level dry air that the system has to fight through, but water temperatures are slightly above normal (+0.5C), so some additional development is possible (thank you to Dr. Jeff Masters for the information).
SEVIRI RGB Air Mass animation of Invest 90Q in the South Atlantic valid on 03/11/2015.
Thanks for reading! I’ll try to follow up on these systems as they develop.
There are certain things you can count on seeing in October. Great post-season baseball! Pumpkin flavored everything! Halloween! Super Typhoons?! To celebrate the successful launch of Himawari-8 from Japan last night, I thought it would be appropriate to post on this latest super typhoon.
Super Typhoon Vongfong has intensified impressively in the last 24 hours after passing through the Marianas Islands yesterday as a Category 2 typhoon with winds ~105 mph. As of 1500 UTC, the Joint Typhoon Warning Center initialized Vongfong as a 135 kt (155 mph) super typhoon and the Satellite Analysis Branch (SAB) of NESDIS classified it as a T7.0, which would support Category 5 winds. Since that time, there has been a slight warming of the cloud tops surrounding the eye, but there is no strong indication of an eyewall replacement cycle, yet. It’s possible that Vongfong may still strenghten some in the next 12-24 hours.
MTSAT2 infrared imagery with GLD-360 Lightning Density overlaid at 30 min increments for Super Typhoon Vongfong.
The satellite animation above shows Vongfong’s rapid organization overnight with intermittent lightning bursts in the eyewall during the rapid intensification. Typically, hurricanes and typhoons don’t exhibit much lightning due to the lack of convective available potential energy (CAPE) and dry air near the strongest thunderstorms. During intense thunderstorm growth, most notably in the outer rain bands, there can be some graupel (soft hail/snowballs) which supports lightning, but the inner core is usually quieter (of course, this varies based on basin). We have seen this before in the West Pacific (see posts on Haiyan and Rammasun).
89GHz RGB image from AMSR-2 on JAXA valid on 10/07/14.
89GHz RGB image from GMI on GPM valid on 10/07/14.
The two microwave image passes above show the convective structure of Vongfong under the clouds where the red coloring indicates heavier precipitation or convection. These high resolution microwaves images are used by JTWC, SAB, and the National Hurricane Center when classification are being made, especially for fixing the initial center positions.
89 GHz RGB image from TRMM with GLD-360 lightning strikes overlaid valid on 10/07/14.
Another interesting way of looking at the microwave imagery is with lightning overlaid. The lightning strikes for the previous 30 minutes were overlaid on this 0719 UTC Tropical Rainfall Measurement Mission (TRMM) satellite pass. As you can see, the lightning matches up quite well with the red colorings (convection). Notice the lightning cluster in the southeast eyewall!
The Day-Night Band image from VIIRS on S-NPP valid at 1703 UTC on 10/07/14. Courtesy of Dan Lindsey (NESDIS/STAR)
Finally, this incredible Day-Night Band (DNB) image was captured by the S-NPP satellite this afternoon. That is not a traditional visible satellite image. . .that is from the moon light! The Proving Grounds receive DNB imagery from NASA SPoRT and CIMSS on a routine basis to help forecasters identify significant features and help with center fixes of tropical cyclones, similar to the microwave imagery.