Exceptionally hot and dry conditions resulted in high fire danger across much of California by mid-June 2024. Forecasters leveraged satellite-based imagery and products to detect and track wildfires and their associated smoke plumes.
The Post Fire developed near Interstate 5 northwest of LA on the 5th and had consumed over 10,000 acres by the next day. From NWS Los Angeles Fire Weather AFD during the morning of the 16th: “GOES-16 satellite imagery indicates that the ongoing Post Fire complex in the vicinity of the I-5 corridor in northwest LA County and adjacent northern Ventura County continues to grow in size and intensity. Weather conditions will become increasingly conducive for further growth and intensification of this complex, especially tonight, and a Red Flag Warning has been issued for the I-5 corridor in northwest LA County and the Ventura County Mountains.”
Associated GOES-West 1-minute Fire Temperature RGB depicts the aforementioned growth and intensification of the Post Fire during the morning of the 16th (Fig. 1).
Later that day, during the early evening, NWS Los Angeles discussed the fire and associated smoke plume: “Heat and smoke from the Post Fire in NW Los Angeles County continued to be noted on satellite, with the smoke now extending well south and east of the fire, encompassing much of Los Angeles County. Haze, smoke, and reduced air quality may become more common across this region overnight. In collaboration with Los Angeles and Ventura Counties, Air Quality Alerts have been issued for areas that may be most impacted.”
GOES 1-minute Geocolor Imagery (True Color Imagery during the daytime) captures wildfire smoke quite well and, in this case, shows it encompassing much of LA County by sunset (Fig. 2). Overlaid on the imagery is Ch07 SWIR imagery for hot BTs to isolate the hotspot, resulting in a pleasing all-encompassing fire/smoke image.
The full evolution of the Post Fire and associated smoke plume on the 16th is shown in the Geocolor-SWIR combo in Fig. 3. Early in the day, smoke is observed to be trapped under an inversion in the mountain valleys and much of the LA city area. The bright flashes east of the fire around 1800-1900 UTC are sunglint off of solar farms. The signal is apparent in VIS, NIR, SWIR, and LWIR channels. The fact that the apparent “hot spot” is seen in VIS bands is a major clue that these are not actual fires. One can confirm the presence of solar farms in Google Earth.
Even more detailed imagery of wildfires can be gleaned from VIIRS. In Fig. 4, the 375-m VIIRS Day Fire RGB captures the exact location of the Point Fire hot spot during the early afternoon, along with the already burned area (burn scar) to its north/northeast, and smoke plume. The small pixels allow one to more accurately geolocate the area of the fire, in addition to being able to detect smaller/cooler fires, compared to with GOES. The user benefits the most when using VIIRS and GOES together for hot spot detection. VIIRS Fire Imagery can be viewed here.
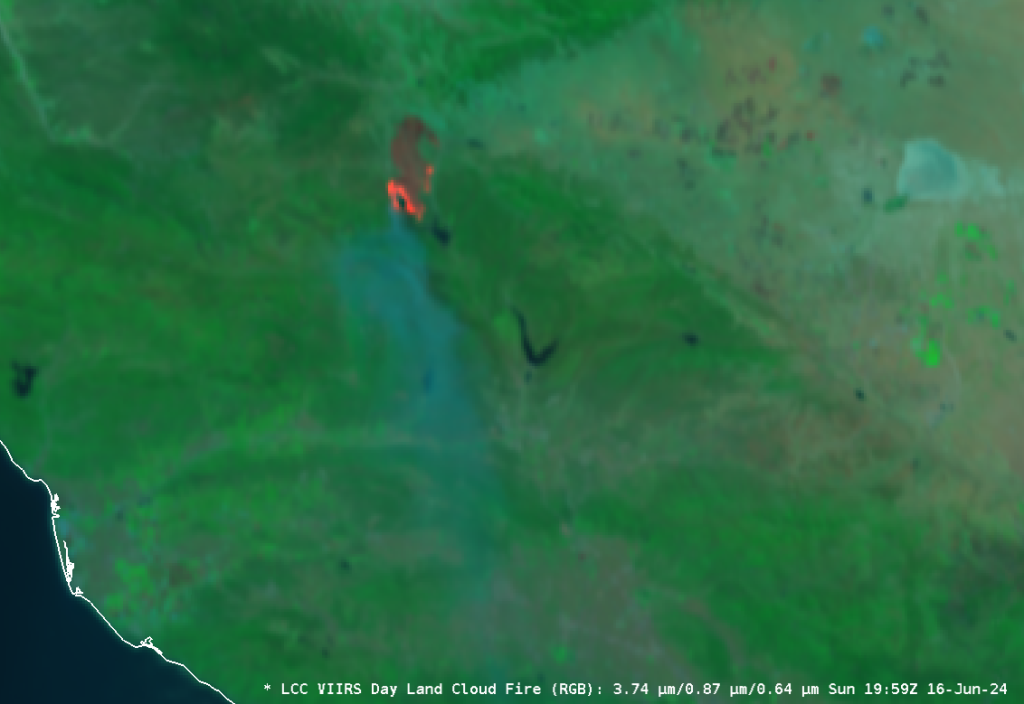
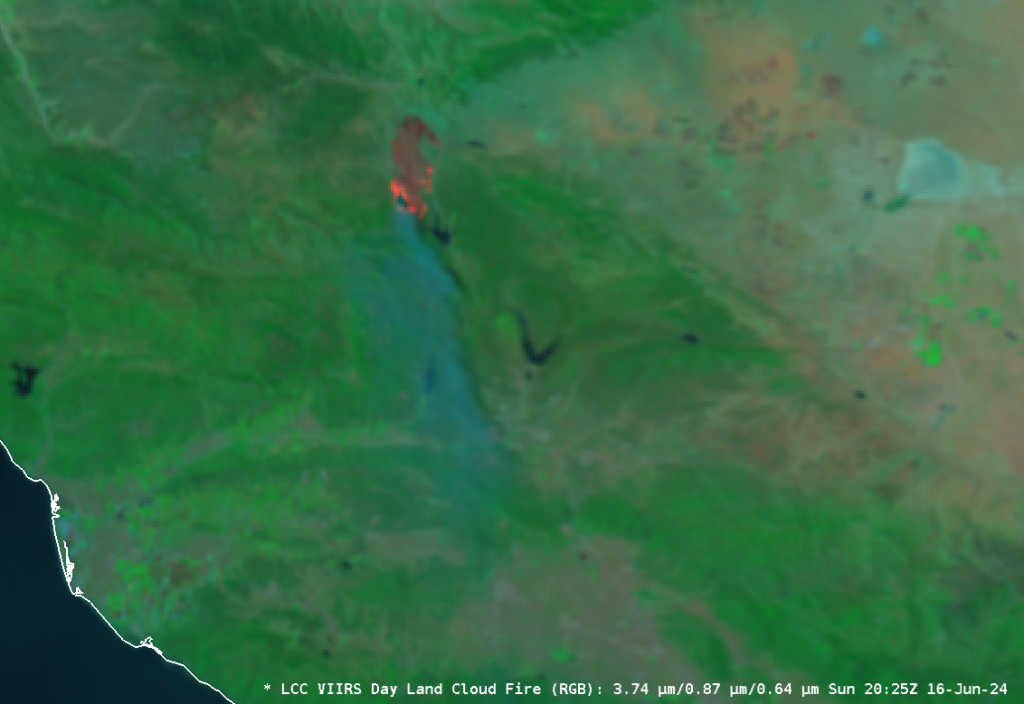
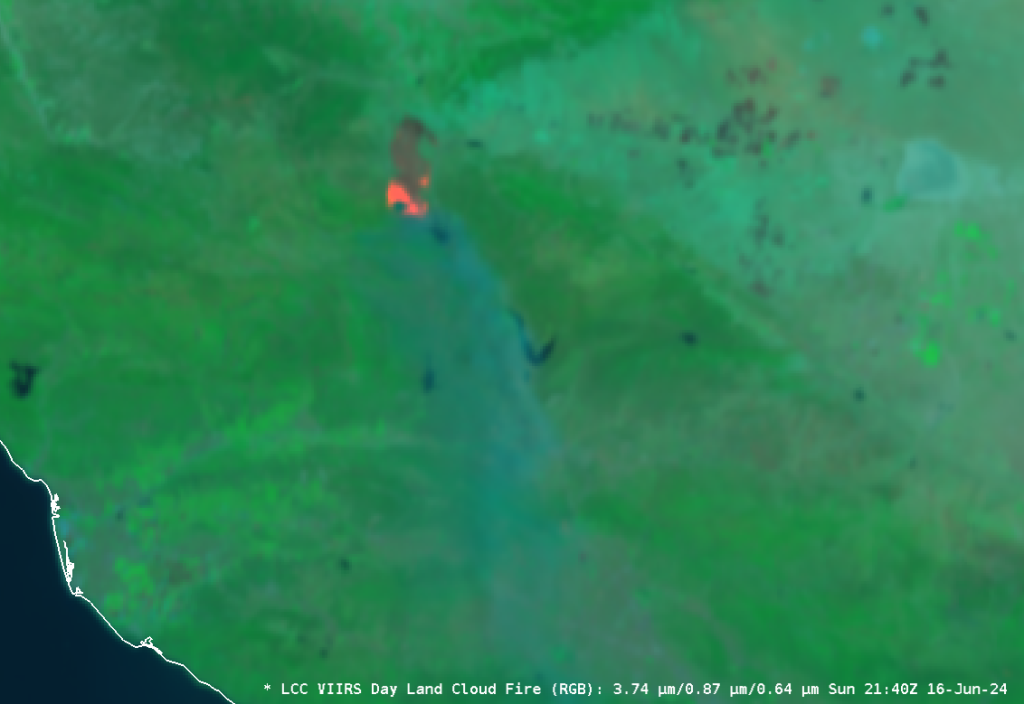
Figure 4: 16 June 2024 VIIRS 375-m Day Fire RGB Imagery over LA County and the Post Fire.
Further north, north of San Francisco, the much smaller Point Fire had burned to around 1,200 acres by the evening of the 17th. NWS San Francisco noted the wildfire and smoke plume in their evening AFD on the 16th: “First and foremost, we continue to monitor a heat signature on GOES West, which is associated with the Point Fire near Lake Sonoma. Current transport flow is from NW to SE, which is taking associated smoke over Santa Rosa, Windsor, Sonoma, and Napa, to name a few.”
The Geocolor-SWIR imagery captures the wildfire and impressive smoke plume in Fig. 5.
It should be noted that such a procedure (Imagery base with a SWIR overlay for only hot BTs) requires setting thresholds and may result in weaker wildfire hotspot signals being missed. Therefore, it is recommended to leverage single-band SWIR imagery alone for hotspot detection (I prefer a linear grayscale colormap). See Fig. 6 for such imagery of the Point Fire, which depicts a hotspot (darker pixels) into the evening, well after the feature was lost in the Geocolor-SWIR imagery procedure shown above. The Geocolor-SWIR procedure is still useful, however, for tasks such as situational awareness, smoke monitoring, and DSS/social media.
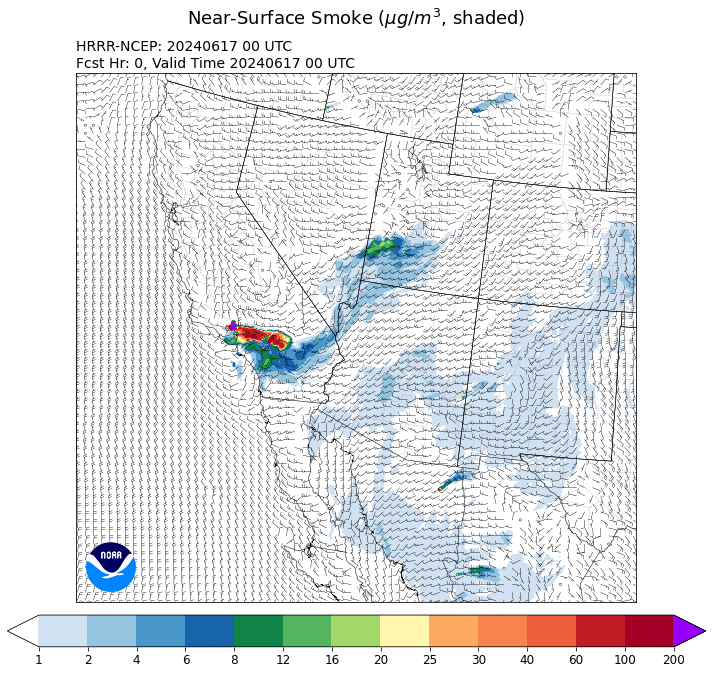
The HRRR-Smoke model depends on hotspot information from VIIRS and MODIS for its initiation and accurate forecasts of smoke. The model is leveraged considerably by NWS, including by the San Diego office during the evening of the 16th: “Unfortunately, north to northwest winds will continue in LA County and bring the smoke into our area through Monday, though the HRRR Smoke model shows at least a decrease in the near-surface smoke near the coast with the sea breeze early Monday afternoon, but smoke aloft will continue to bring hazy conditions.” Corresponding HRRR Near-Surface-Smoke imagery from the 17th-00Z forecast is shown in Fig. 7.
Bill Line, NESDIS/STAR
